

Most manufacturers have spend data. Far fewer have spend clarity.
Direct materials spend analysis is often treated like a reporting exercise: export the data, sort it, chart it, move on. The problem is that reporting doesn’t surface opportunity by itself. The value of spend analysis comes from interpretation—seeing patterns that signal where leverage, risk, and inefficiency are hiding.
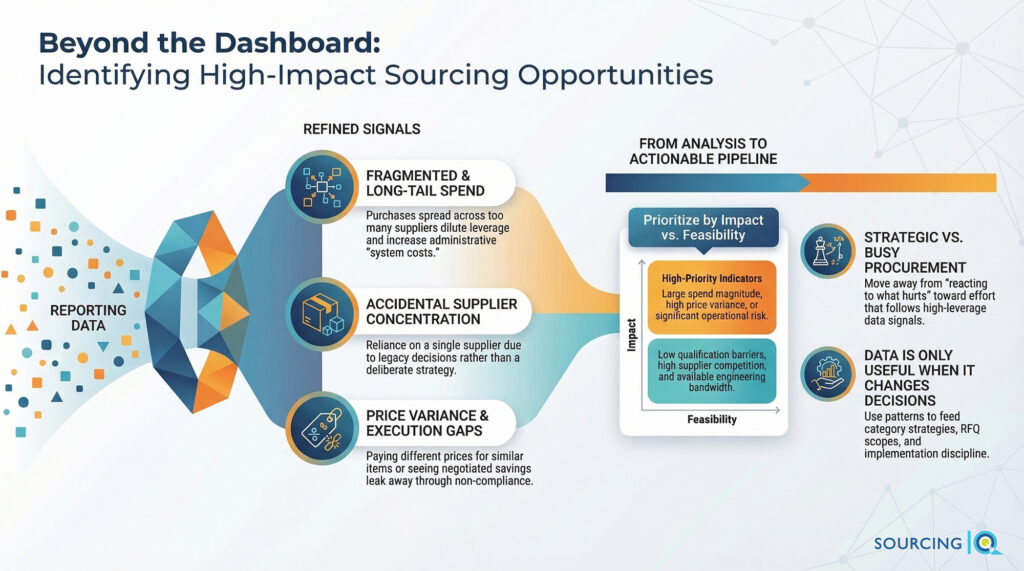
Below are some of the diagnostic signals that can help your business find high-impact sourcing opportunities. It’s not about how to build a spend cube or which tool to use. It’s about what to look for in your direct materials spend—and what those patterns usually mean—so you can prioritize the right sourcing actions instead of chasing whatever is loudest this week.
What Spend Analysis Is (and What It Is Not)
Spend analysis is a diagnostic tool. It helps answer a small set of high-value questions:
- Where is spend fragmented in ways that limit leverage?
- Where is spend concentrated without an intentional strategy?
- Where are we paying different prices for similar items (and why)?
- Where are we carrying complexity that adds cost without adding value?
- Where are sourcing decisions not sticking?
Spend analysis is not:
- a perfect dataset project
- a dashboard-building exercise
- a one-time “savings report”
- proof that savings exists (it’s evidence of where to investigate)
Put simply: data is only useful when it changes decisions. Spend analysis becomes valuable when you can translate patterns into action.
Diagnostic Signal #1 — Highly Fragmented Spend
What it looks like
Spend spread across many suppliers for the same or similar materials—often across plants, programs, or business units.
What it typically indicates
- Decentralized buying behavior (plants solving problems locally)
- No category-level ownership (“everyone buys, no one manages”)
- Missed volume aggregation opportunities
- “Relationship suppliers” that never get compared
Why it matters
Fragmentation dilutes leverage. Even modest consolidation (when safe) can improve pricing tiers, simplify supplier management, and reduce administrative overhead.
In manufacturing, fragmented spend is usually a sign that sourcing evolved organically rather than strategically. It’s not a moral failure—it’s a systems outcome. But it’s also one of the clearest places to find opportunity.
Where this tends to lead: volume aggregation or selective consolidation—and often a structured RFQ to test pricing.
Diagnostic Signal #2 — Supplier Concentration Without Strategy
What it looks like
One supplier (or a small group) owns most of the spend in a category—but without a clear rationale, documented constraints, or a deliberate single-source strategy.
What it typically indicates
- Legacy decisions that were never revisited
- De facto single-source situations
- Complacency in pricing and performance
- Qualification barriers that nobody wants to say out loud
Why it matters
Concentration isn’t inherently bad. Intentional single sourcing can be the right call when qualification is heavy, capacity is constrained, or performance consistency matters.
The issue is unmanaged concentration. Spend analysis helps you distinguish between:
- Intentional dependency (chosen and managed)
vs. - Accidental dependency (inherited and ignored)
That distinction drives very different actions: reinforce and develop the supplier, dual-source, or run a qualification effort to create options.
Where this tends to lead: alternative supplier qualification, supplier development, and term/risk alignment—not just price pressure.
Diagnostic Signal #3 — Wide Price Variance for Similar Items
What it looks like
The same or comparable materials/components purchased at meaningfully different prices across plants, suppliers, programs, or time periods.
What it typically indicates
- Inconsistent sourcing practices across plants
- Local negotiations without a market benchmark
- Spec variation that doesn’t need to exist
- Quote assumptions that were never aligned (volumes, packaging, incoterms, lead times)
Why it matters
Price variance is rarely “random.” It’s usually a signal that the organization doesn’t have a category view—or doesn’t act on it.
In direct materials, variance is often the start of a bigger conversation:
- Are we buying the same thing in different ways?
- Are we over-spec’d in one place?
- Are some plants getting better commercial terms?
- Are suppliers pricing to different risk levels?
Where this tends to lead: structured RFQs, spec alignment, and category strategy tightening.
Diagnostic Signal #4 — Long-Tail Suppliers With Minimal Spend
What it looks like
A large number of suppliers accounting for a very small percentage of total spend.
What it typically indicates
- SKU proliferation and one-off sourcing decisions
- Poor standardization across plants
- “Emergency adds” that never get cleaned up
- Suppliers that escape performance scrutiny because they’re small
Why it matters
Long-tail suppliers add complexity without delivering proportional value. They increase administrative workload, dilute procurement focus, and make it harder to manage performance.
This is one of the most overlooked opportunity areas because the dollars per supplier are small—but the system cost is not. Long-tail clean-up often improves:
- administrative efficiency
- supplier management clarity
- compliance to preferred sources
- overall sourcing discipline
Where this tends to lead: supplier/SKU rationalization and governance improvements—often with quick wins.
Diagnostic Signal #5 — Spend Misaligned to Category Importance
What it looks like
Procurement attention is concentrated on low-impact categories while high-impact categories receive minimal structured effort.
What it typically indicates
- Reactive prioritization driven by urgency and noise
- “We focus on what hurts” rather than what matters most
- Limited visibility into category economics
- No repeatable sourcing cadence
Why it matters
Not every category deserves equal effort. Spend analysis gives you the evidence to align sourcing intensity with impact—especially in lean teams.
This is the difference between:
- busy procurement (everything is urgent)
and - strategic procurement (effort follows leverage)
If a category represents significant spend and meaningful operational risk, it should have:
- a category owner
- an explicit strategy
- a sourcing event cadence (when appropriate)
- performance expectations
Where this tends to lead: prioritization, a sourcing pipeline, and a playbook approach.
Diagnostic Signal #6 — Spend Patterns That Suggest Execution Gaps
What it looks like
- Negotiated savings that never materialize in actual spend
- Spend drifting back to prior suppliers or pricing
- Purchases occurring outside defined sourcing decisions
- “Exceptions” becoming the default
What it typically indicates
- Weak governance and compliance
- Lack of implementation ownership after awards
- Inconsistent enforcement across plants
- Poor visibility into maverick buying or price updates
Why it matters
This signal is critical because it’s easy to misdiagnose. Teams often treat this as a strategy problem (“we need better negotiations”) when it’s actually an execution problem.
In manufacturing, savings leakage is common when:
- pricing isn’t updated cleanly in systems
- plants aren’t aligned to the award
- supply issues trigger workarounds
- exceptions are easier than compliance
Spend analysis can surface these patterns early—before “cost creep” becomes the new normal.
Where this tends to lead: governance/compliance, supplier performance management, and implementation discipline—often more than another round of negotiation.
Turning Spend Signals Into Sourcing Priorities
Diagnostics only matter if they change what you do next.
Strong teams translate spend signals into a prioritized sourcing pipeline by balancing two things:
1) Impact
- category spend magnitude
- cost reduction potential (variance, fragmentation, legacy pricing)
- operational risk exposure (single-source, performance issues)
2) Feasibility
- qualification and switching requirements
- supplier market competitiveness
- engineering/operations bandwidth
- timing (contract cycles, demand stability, capacity constraints)
The goal isn’t to build a massive opportunity list. It’s to prioritize and answer: Where should we act first?
This is also where spend analysis feeds the rest of the system:
- spend signals → category strategy
- category strategy → RFQ scope + supplier shortlist
- RFQ outcomes → cost reduction levers
- awards → governance + compliance to keep savings from leaking
Spend Analysis Finds the Money—Execution Captures It
Direct materials spend analysis doesn’t reduce cost by itself. Its job is to reveal where opportunity, risk, and inefficiency are hiding—and point you toward the most valuable next actions.
Manufacturers that treat spend analysis as a diagnostic discipline—not a reporting task—are better positioned to run smarter sourcing events, apply the right cost reduction levers, and protect savings over time.