

Most manufacturers have a reasonable suspicion that savings exist somewhere in their procurement spend. The challenge is knowing where to look.
Direct materials purchasing tends to evolve organically. Plants build supplier relationships independently. Sourcing decisions get made locally. Data accumulates across multiple ERP systems with inconsistent naming, inconsistent categories, and no one responsible for reconciling it into a coherent picture.
So, the savings stay hidden because they’re hard to find.
Here’s what procurement teams that consistently find savings understand: opportunity identification is an analytical problem, not a negotiation problem. The signals are in the data. You just have to know what you’re looking for.
Start With Spend Visibility
Before you can identify where savings are hiding, you need a clear picture of how direct materials spending is actually distributed across your organization.
That means looking at purchasing data across three dimensions simultaneously: which suppliers you’re using, what categories you’re buying, and which plants or business units are doing the buying. This is exactly what a direct materials spend cube is designed to reveal — and it’s why structured spend analysis is always the starting point, not the middle step.
Without this visibility, opportunity identification is guesswork. With it, patterns that were invisible inside plant-level ERP reports start showing up clearly at the enterprise level.
What you’re looking for in that data are signals — structural indicators that savings exist and haven’t been captured yet.
We help procurement teams build opportunity pipelines based on data, supplier markets, and operational priorities.
Signal #1: Supplier Fragmentation
Fragmentation is the most common savings signal in manufacturing procurement, and it’s almost always the result of organic growth rather than deliberate strategy.
Plants add suppliers to solve immediate problems. Engineering introduces vendors for specific parts. Acquisitions bring new supplier bases that never get rationalized. Over time, a category that could be served by two or three suppliers ends up supported by eight or ten — each with small volumes, inconsistent pricing, and no real leverage being applied to any of them.
What fragmentation looks like in the data:
- Multiple suppliers producing similar or identical components
- Low annual spend per supplier in a category that represents significant total spend
- Overlapping capabilities across the supplier base
- No clear “strategic” vs. “transactional” distinction in how suppliers are managed
Fragmentation is expensive in two ways: you pay more per unit because your volume is split, and you spend more time managing relationships that don’t need to exist. Consolidation — where the market and operational constraints support it — addresses both.
Signal #2: Cross-Plant Price Variation
When plants source independently, prices diverge. That’s not an opinion — it’s math. Different buyers, different relationships, different negotiating contexts, and no one comparing notes.
The result: two plants buying the same machined component from different suppliers at meaningfully different prices. Or the same supplier charging different rates across facilities because contracts were negotiated separately, years apart, with no one tracking the gap.
This signal is invisible inside plant-level reporting. It only surfaces when you look across the organization at the same time.
Cross-plant price variation is one of the clearest indicators that coordinated sourcing would create immediate value. The opportunity isn’t theoretical — you can often see the dollar gap directly in the data. The question is whether the organization has the appetite and governance to act on it.
Signal #3: Long-Tail Supplier Spend
Every manufacturer has a supplier long tail — a large number of vendors that each account for a small fraction of total spend. A hundred suppliers representing 5 percent of total purchasing. Sometimes more.
Long-tail suppliers often exist for legitimate reasons: specialized capabilities, one-off engineering requirements, legacy parts with no obvious alternatives. But they also accumulate from habit, convenience, and inertia.
What the long tail costs you:
- Administrative time and overhead that’s disproportionate to the spend
- Supplier relationships that never get performance-managed because the volume doesn’t justify the effort
- Purchasing activity that happens outside of any structured sourcing process, often through informal channels
Not every long-tail supplier should be eliminated. But every long tail deserves scrutiny. The question to ask is whether the relationship exists because of a genuine operational requirement — or because nobody ever revisited it.
Signal #4: Categories Without Active Sourcing
This one is quieter than the others, but it’s often where some of the biggest savings live.
Some categories haven’t seen a competitive sourcing event in years. The current supplier delivers, invoices get approved, and nobody questions the pricing because production isn’t being disrupted. Meanwhile, market conditions have shifted. New, qualified suppliers have emerged. The existing supplier’s cost structure has changed. And the pricing from five years ago bears no relationship to what the market would deliver today.
The warning signs are easy to spot once you’re looking:
- Pricing that has essentially been static for multiple years
- No recent RFQ activity in the category
- Supplier relationships that predate the current procurement team
- Limited or no competitive benchmarking on file
Even well-performing suppliers should be tested periodically—not because you’re looking to replace them, but because market validation protects you from gradual cost creep and gives you the data to have a fact-based conversation about pricing when it’s time.
Signal #5: Spend Misaligned to Category Importance
This one shows up in how procurement attention is allocated, not just in raw spend data.
In many manufacturing organizations, procurement energy gets consumed by urgent, noisy categories — the ones that cause production problems, the ones that require constant expediting, the ones where supplier relationships are strained. Meanwhile, large, stable categories with significant spend and real market competition sit in the background, untouched.
Look at where your team spends its time relative to where the money is. If your highest-effort categories aren’t your highest-spend or highest-risk categories, you have a prioritization problem — and buried savings in the categories that are being ignored.
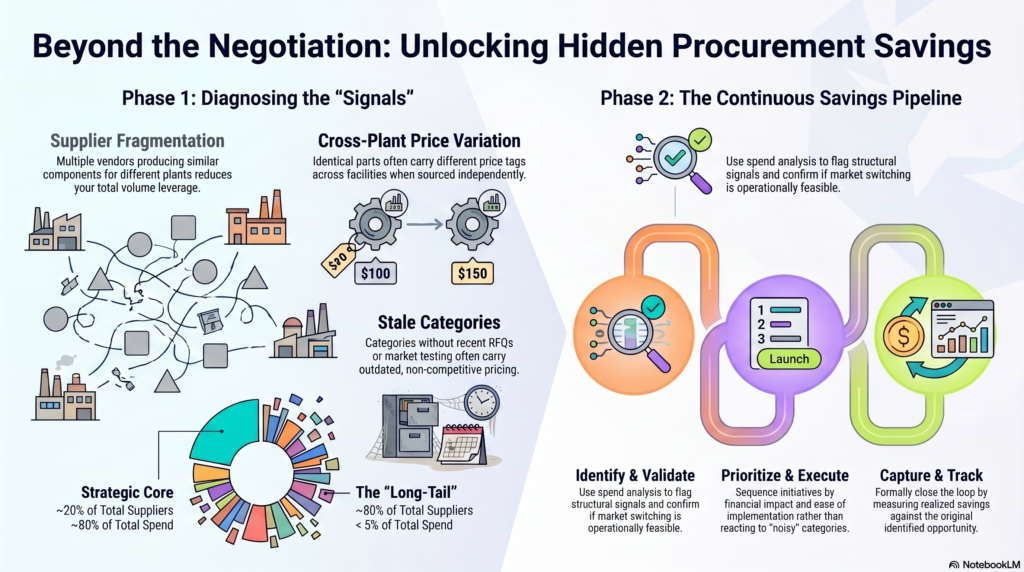
From Signals to a Savings Pipeline
Finding signals is the diagnostic step. Turning them into value requires a pipeline.
Mature procurement organizations don’t chase savings reactively — they manage a forward-looking opportunity pipeline that converts spend analysis insights into sourcing initiatives on a rolling basis.
The pipeline logic is straightforward:
- Identify — flag opportunities through spend analysis and the signal patterns above
- Validate — confirm the opportunity is real: is the supplier market competitive? Is switching feasible? What are the qualification constraints?
- Prioritize — sequence by impact and feasibility, not just size
- Execute — build the sourcing strategy, run the event, make the award
- Capture — track realized savings against identified opportunities, close the loop
This keeps procurement from cycling through the same reactive patterns year after year. It shifts the function from “responding to what’s urgent” to “working on what matters.”
Procurement Savings Are Discovered, Not Negotiated
It’s worth saying one more time: the manufacturers that consistently find and capture savings aren’t necessarily better negotiators than everyone else. They’re better at looking.
They analyze spend across suppliers, categories, and plants. They know what fragmentation looks like. They can spot price variation before it shows up as a budget problem. They have a view of which categories haven’t been tested recently. And they convert those insights into a sourcing pipeline that runs continuously — not just when margins are under pressure.
Savings don’t hide in suppliers. They hide in structure. Find the structural inefficiencies, and the savings follow.